Reporting on event registrations and attendance
Have the data at your fingertips on everything to do with registrations and attendance with EventReference Reporting. Our belief is that being able to report quickly and efficiently on all aspects of your event is key to understanding how to make the event work better for everyone. That's why you’ll find the reporting function so powerful.
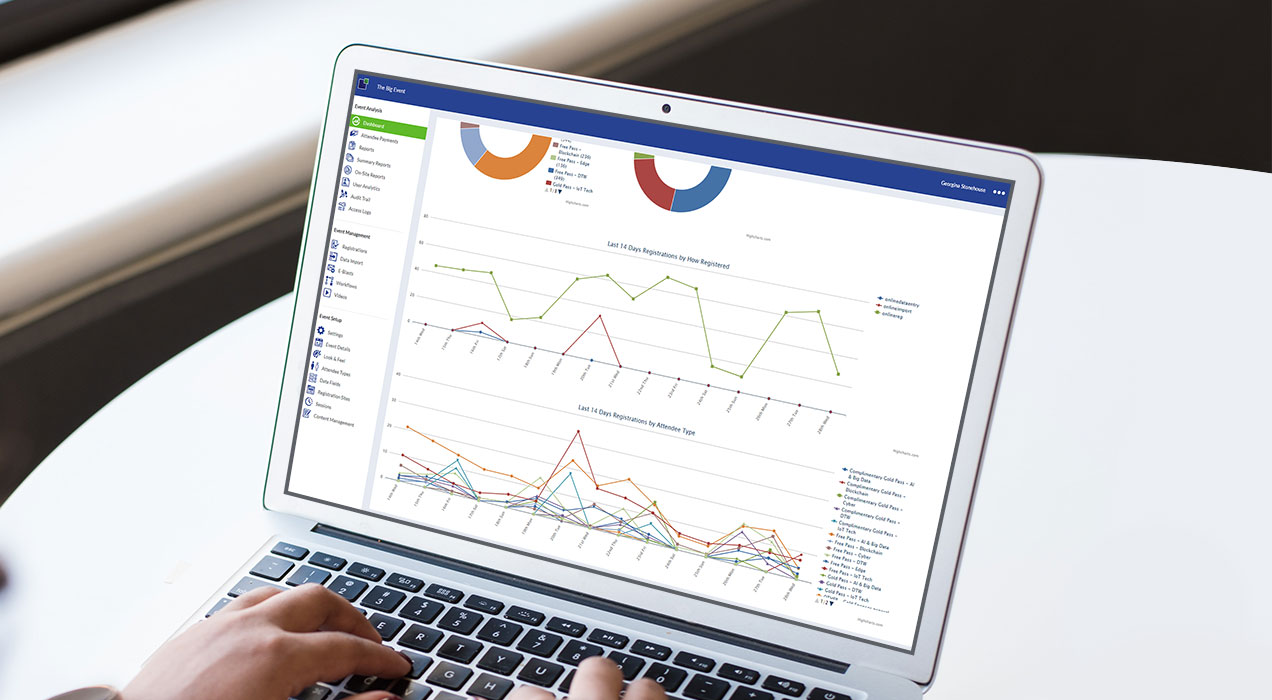
View high level statistics
The reporting dashboard allows you to see high level statistics about your event registrations. You can easily create summary reports with graphs so that you have a complete overview of your event.
Comprehensive reporting system
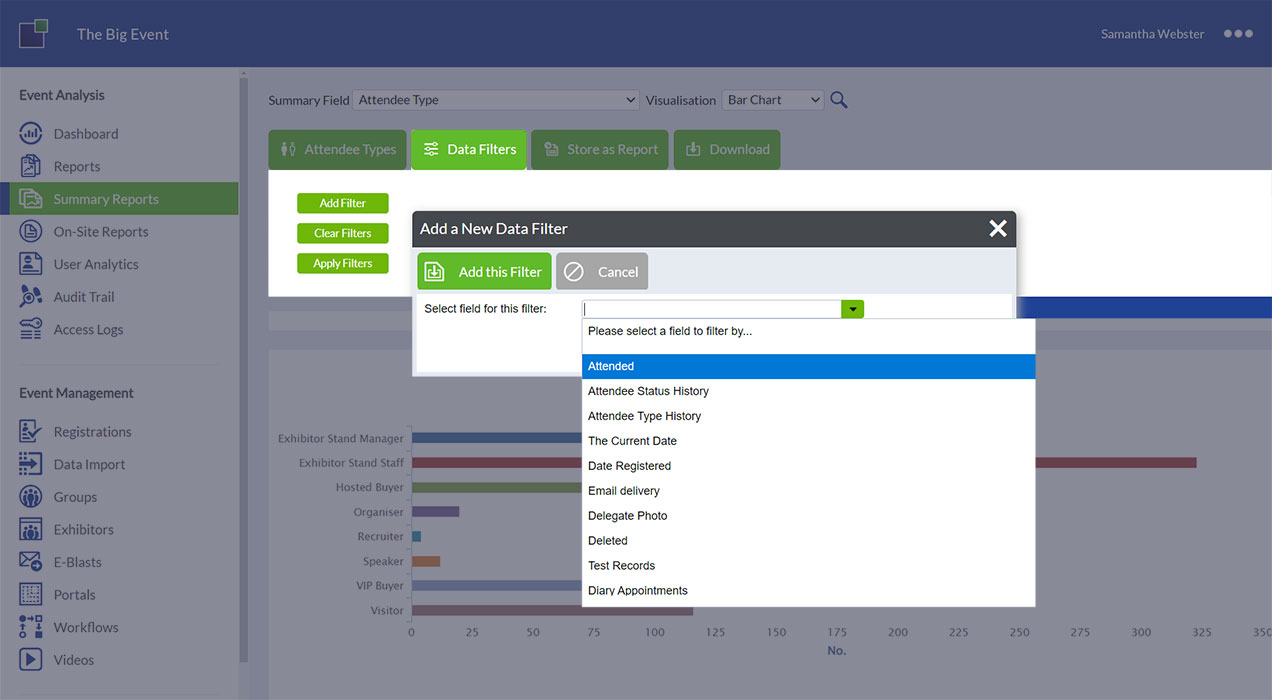
Reporting is one of the most important aspects of the EventReference system. The reporting tools are at the heart of managing your event effectively. That's why you will find powerful filtering, sorting and field selection capabilities to create reports containing exactly the information you want. What’s more, you can store the reports and run them again. You have, with EventReference reporting, one of the most capable reporting systems available.
Summary reports with charts
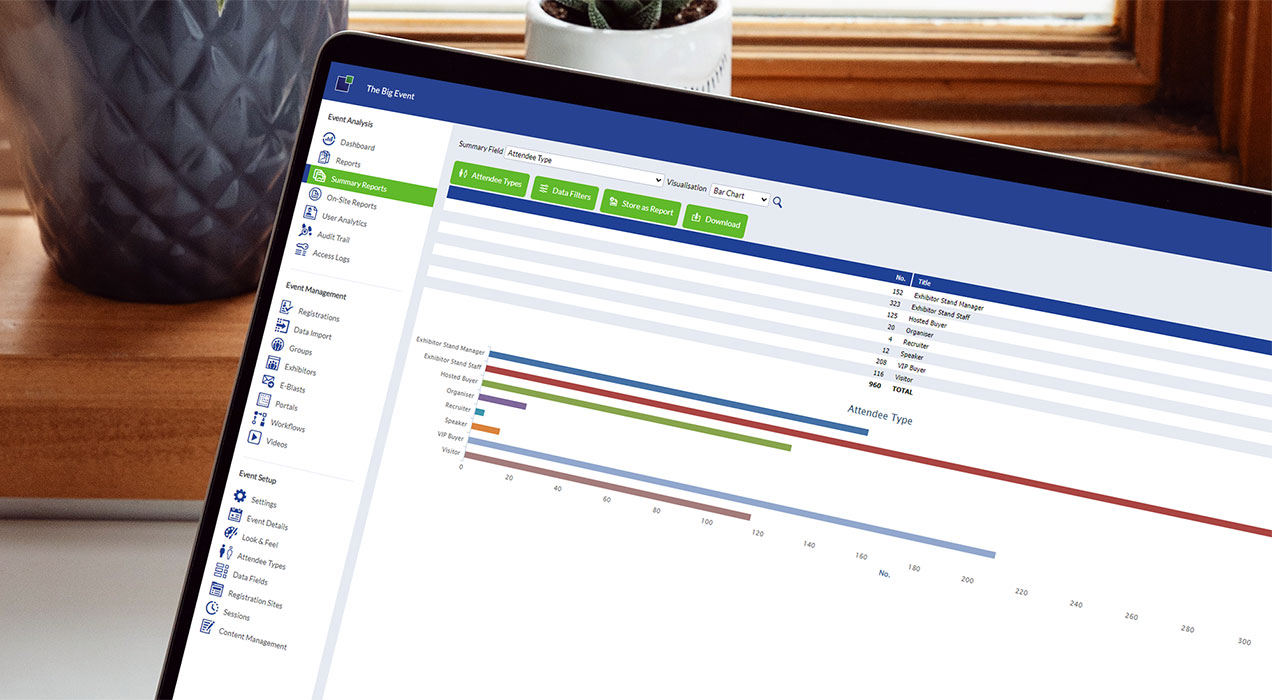
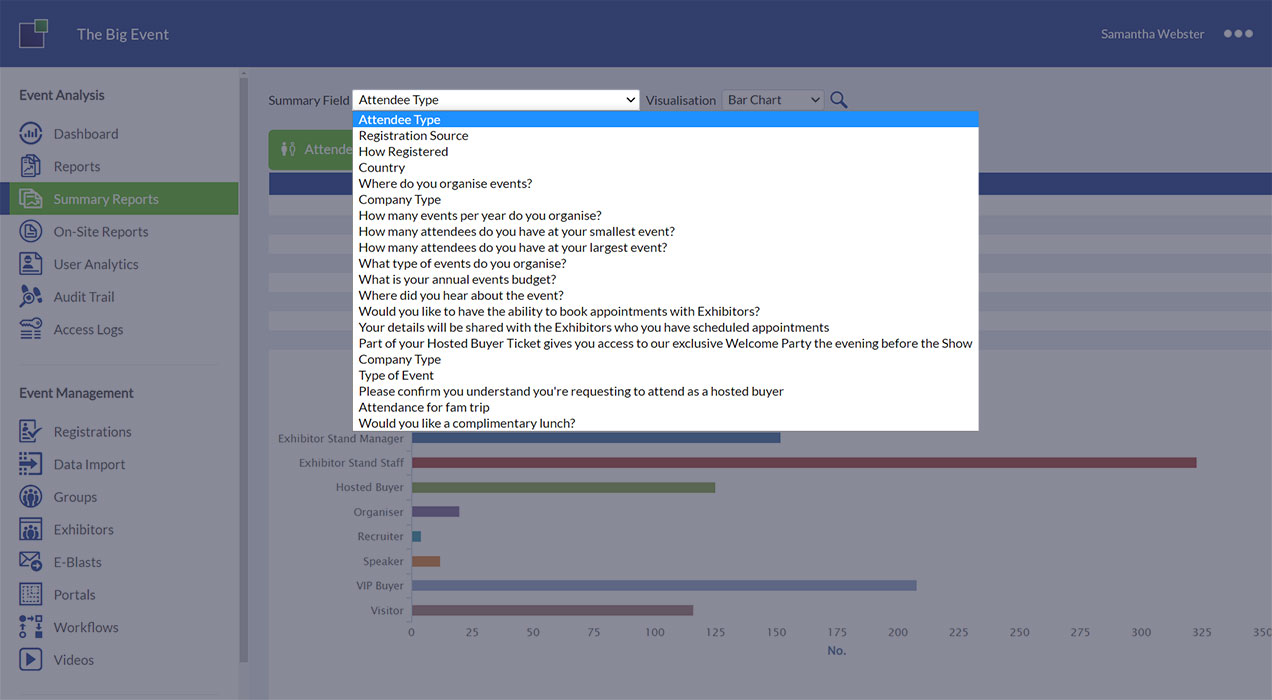
It's true! A picture paints a thousand words. Summary Reports enable you to choose a multiple choice field from your data fields and instantly create charts and graphs from the data within that field. You can filter the results too by including or excluding specific criteria so that you get exactly the graph or chart you need.
- Save your chart or graph as a favourite
- Rerun it with refreshed data
- Download the data to use in Excel or another program
Award-winning event registration solutions trusted by event organisers around the world
Detailed attendee reports
Understanding your attendees is crucial to the event success. Powerful filtering on attendee lists helps you to get the answers you need. Filters can be easily applied to any field in the system and can be done in real-time for up to date and instant information.
Control report fields
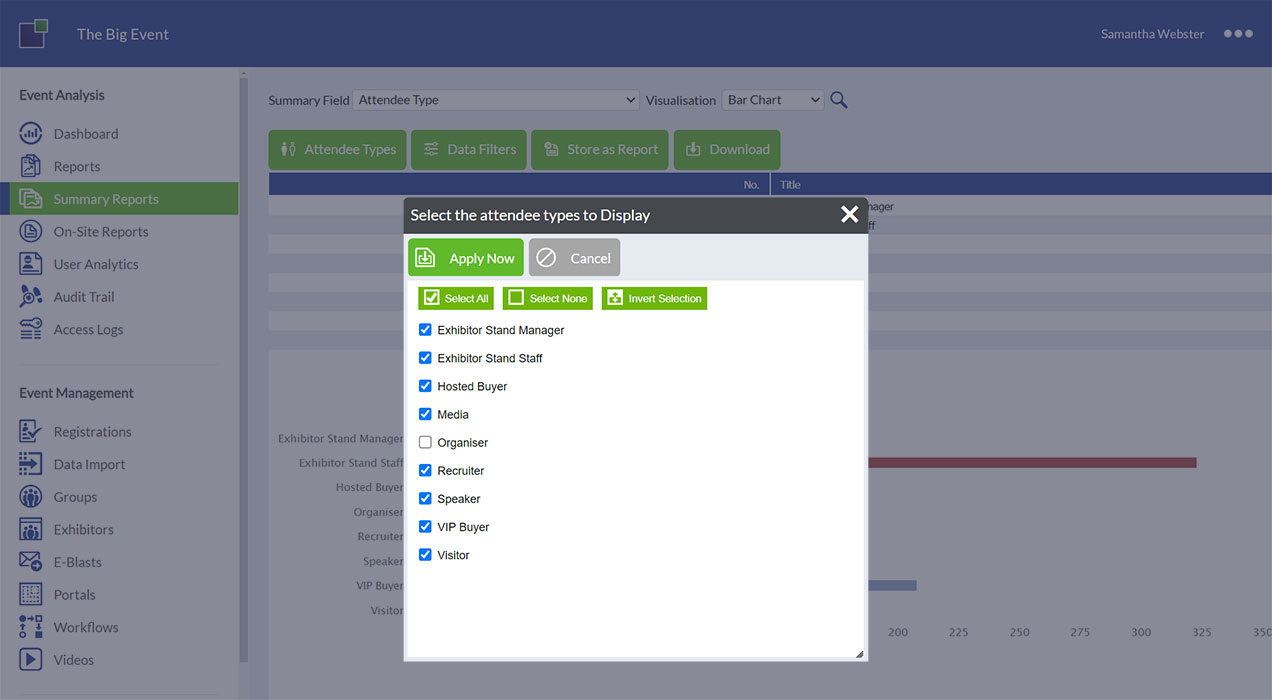
You probably don’t want to see fields in your report that are not relevant. EventReference knows that, so you are able to select only the data fields you do want to see. You can even change the order of the fields in your report. This makes it much easier when you download your data into Excel.
Store reports to run again
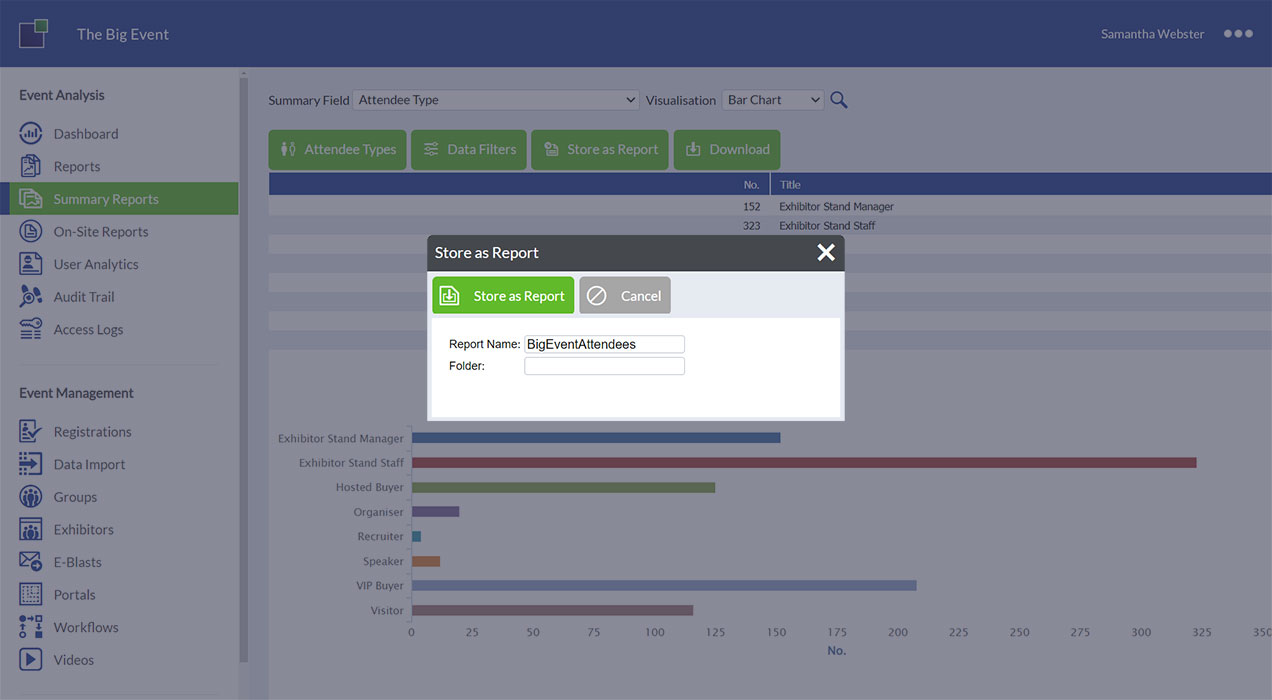
Once you've created your perfect report with filters, fields and sort order, you might want to save those choices so that you can re-run the report in the future. EventReference reporting enables you to quickly and easily store your preferences into a named report. You can organise your named reports into different folders and re-run them with the latest data at any time.
Download reports to Excel
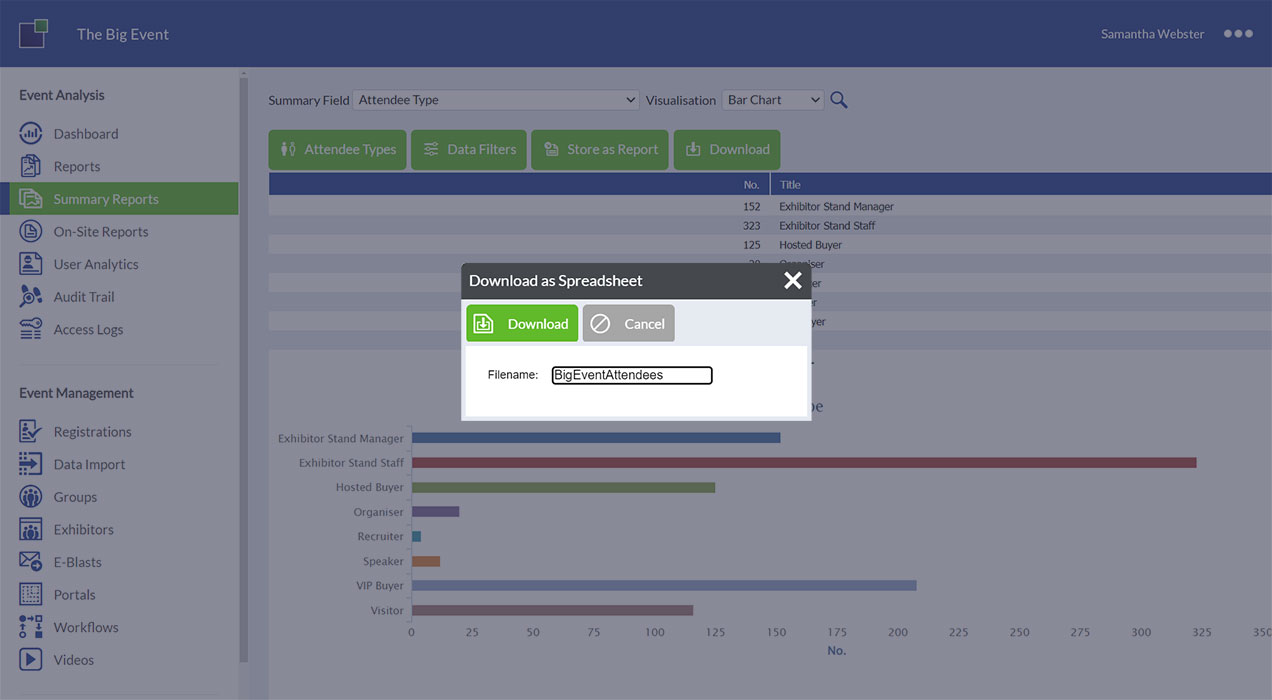
We designed EventReference to work alongside Microsoft Excel (and other spreadsheet software like Apple Numbers) because there’s no point in reinventing the wheel! Excel is superb at sorting data and has a fantastic feature that allows you to import data straight from a website. We’ve provided the ability within EventReference to expose a stored report to Excel which means you can seamlessly get that data updated in Excel any time you want.
Ask us a question, send a brief, request a quote…
